Logs and runs
See what sedge did, how long it took, and what went wrong, on your machine only.
sedge keeps a record of what it does, for you. Nothing is sent anywhere: there is no telemetry to us or anyone else, and no exporter to turn on by accident.
Runs
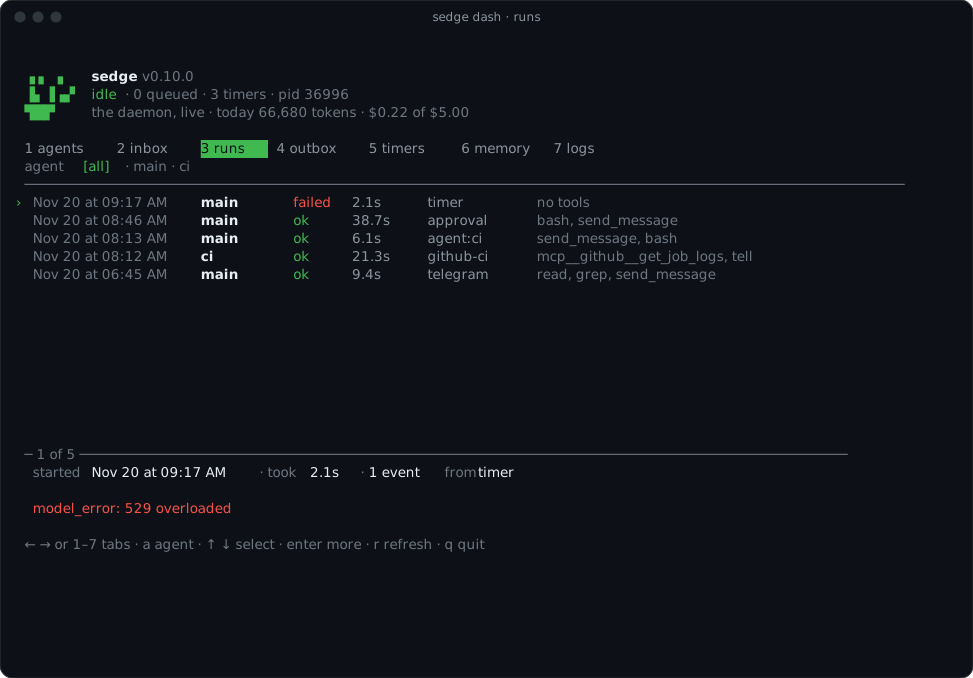
Every run is recorded when it ends (events triage skipped never started one; they show in the inbox as skipped):
- which agent ran, and what woke it (a Telegram message, a signal, a timer);
- how long it took, and whether it worked; if not, why;
- each tool call, with how long it took and whether it failed;
- the tokens it used, and their cost at the model's listed price, when it lists one (see Limits and costs).
sedge dash runs (or /sedge runs in the TUI) lists them, newest first. Select one for its tool
calls on a timeline.
Logs
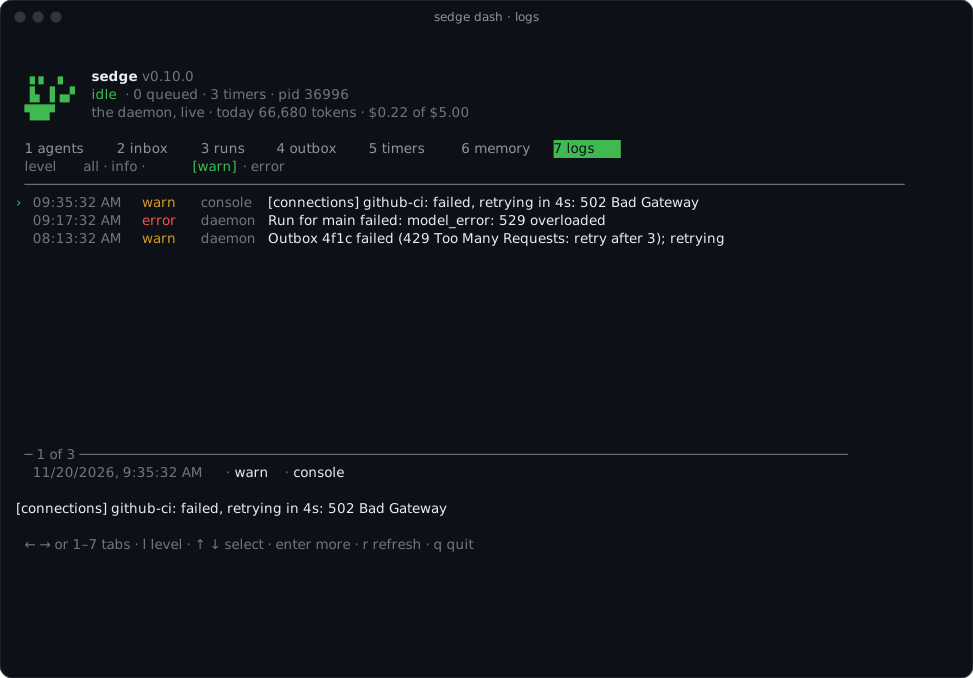
Everything the daemon logs is kept: its own lines, and whatever pi, MCP servers, channels and
signals print. sedge dash logs shows them, newest first; l steps through levels (all, info,
warn, error).
Numbers
The dashboard's header counts, since the daemon started:
- runs, and how many failed;
- how long runs take on average, and the slowest;
and what the agents used today: tokens and their cost, against your daily limits when you set them.
These are Effect metrics, kept in memory. The daemon also counts tool calls, events by source, and deliveries.
Where it's kept
| File | What |
|---|---|
~/.sedge/logs/runs.jsonl | One line per finished run. |
~/.sedge/logs/sedge.jsonl | One line per log line, with its level and source. |
~/.sedge/logs/daemon.log | The daemon's plain output, as before. |
Each moves aside past 10 MB, keeping one previous file. They're plain JSON lines: read them with
jq, or delete them whenever you like.